Logs & Metrics
Distr gives you observability for every deployment target via logs that let you dig into what happened, and metrics that track resource usage over time.
Deployment Status
Section titled “Deployment Status”Each deployment within a target also has its own colored dot and status label. This tells you whether the application itself is healthy, not just whether the agent is reachable:
- ⚫ No status — The agent has not reported anything for this deployment yet.
- 🔴 Error — Something is wrong. Healthchecks are failing or the deployment encountered an error.
- 🟡 Stale — The agent has not reported this deployment’s health in the last 60 seconds.
- 🔵 Progressing — The agent is installing or upgrading the deployment, or containers are still starting up.
- O Running — The deployment is running but no healthchecks are configured.
- 🟢 Healthy — The deployment is running and all healthchecks are passing.
Clicking the status label (e.g. “Running”) opens the log viewer with the full status history for that deployment.
Healthchecks
Section titled “Healthchecks”Configure healthchecks so Distr can distinguish between Running (no checks configured) and Healthy (checks passing). Without them, a deployment that starts but serves errors will still show as Running.
- Docker deployments: Add a healthcheck to your service definition in the Compose file.
- Kubernetes deployments: Configure container probes (liveness, readiness, or startup probes).
Log Viewer
Section titled “Log Viewer”The log viewer is a dedicated page for inspecting all log data associated with a deployment target. Open it by clicking the deployment target name, clicking Inspect on a deployment, or selecting Agent Logs from the ⋮ menu.
Once open, use the breadcrumb dropdowns to switch between deployment targets and views. The view dropdown lets you choose what to inspect:
- Deployment Status — The history of status transitions for the selected deployment.
- Agent Logs — Raw output from the Distr agent process: connection events, reconciliation cycles, errors. Always available.
- Container resources — Application container logs (e.g.
backend-1,proxy-1). Only available when log collection is enabled.
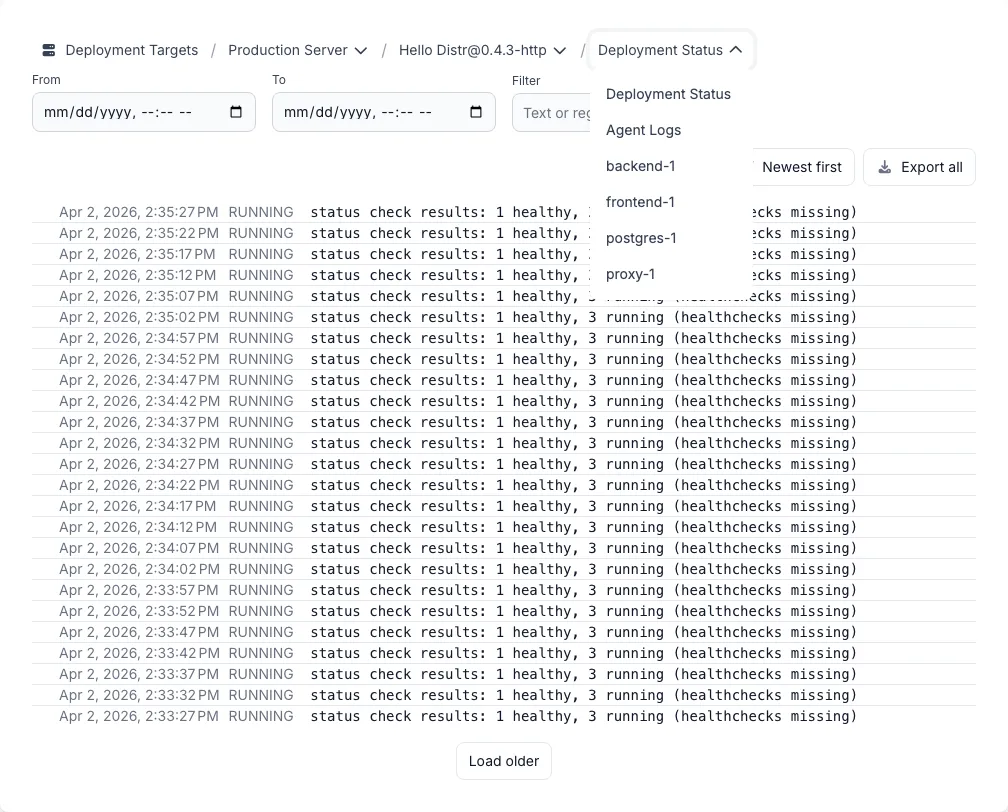
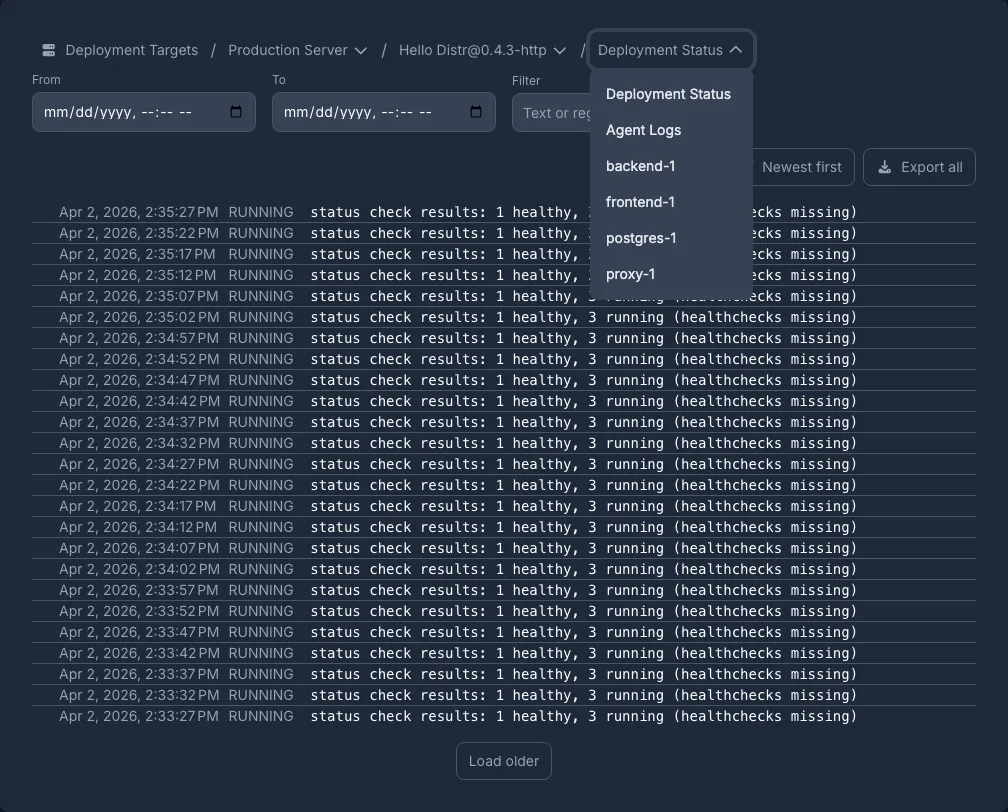
The log viewer auto-refreshes every 10 seconds. Use the From and To fields to view a specific time window, or the Filter field to search with plain text or a regular expression. You can pin any log entry by clicking the thumbtack icon on hover — the row stays sticky while you scroll, making it easy to compare entries.
Agent Logs
Section titled “Agent Logs”Agent logs show the raw output from the Distr agent process itself — connection events, deployment reconciliation cycles, errors, and status reports. These logs belong to the deployment target, not to any individual deployment, and are always available without any setup.
Container Logs
Section titled “Container Logs”Container logs show the output from your application containers. Log collection can be configured in two places:
- When creating a deployment — The deployment form includes an Enable log collection toggle in the configuration step. It is enabled by default.
- After deployment — Click the ⋮ menu on the deployment to enable or disable log collection at any time.
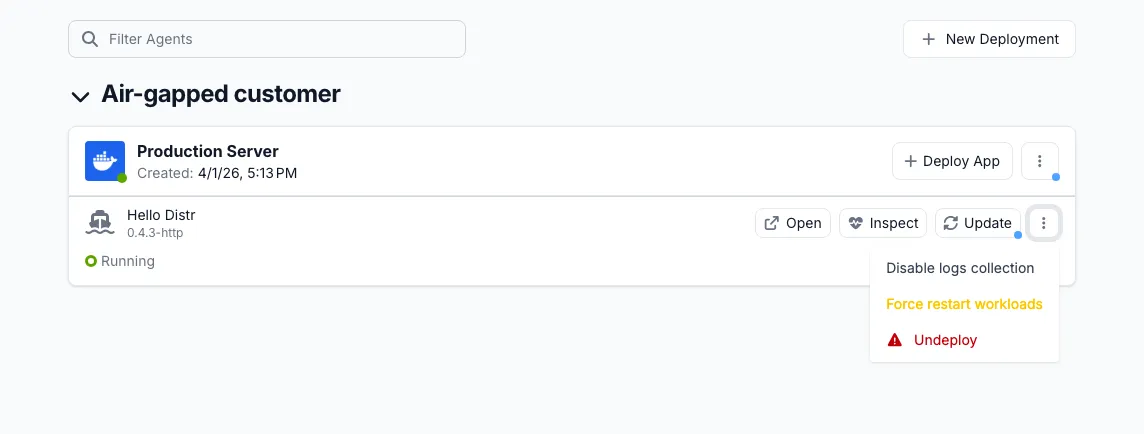
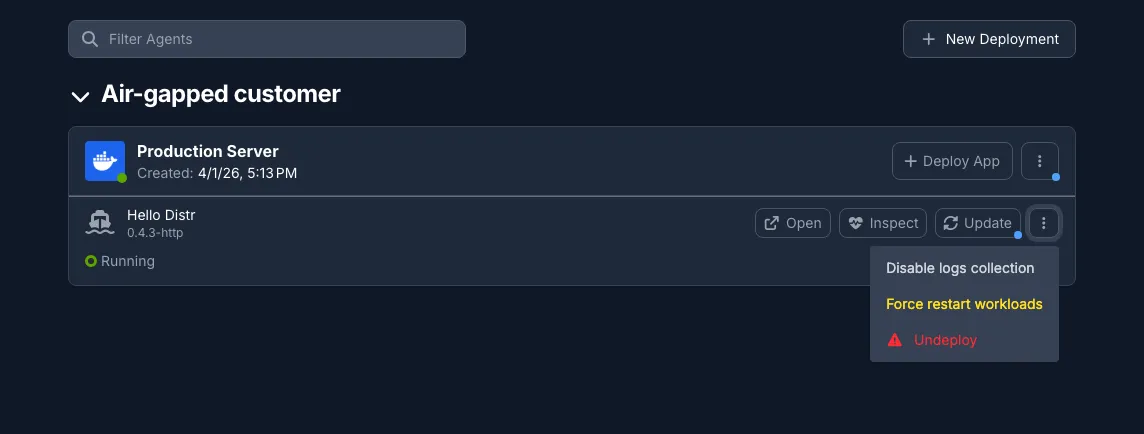
The first logs should appear within 30 seconds. To disable, open the same menu and select Disable log collection.
Active and Archived Resources
Section titled “Active and Archived Resources”The view dropdown separates container resources into active and archived:
- Active — The resource has produced logs in one of the five most recent deployment revisions.
- Archived — The resource only has logs from older revisions, typically because a container was renamed or removed during an update.
Click Show archived at the bottom of the dropdown to reveal archived resources.
Metrics
Section titled “Metrics”Metrics give you visibility into the resource usage of the host or cluster running your deployments. Metrics collection can be toggled per deployment target.
Enabling Metrics
Section titled “Enabling Metrics”- Navigate to the deployment target in the Deployments view.
- Click the ⋮ menu and select Edit.
- Enable the metrics toggle.
Once enabled, the agent scrapes and reports metrics every 30 seconds.
Collected Metrics
Section titled “Collected Metrics”The following metrics are collected for both Docker and Kubernetes deployment targets:
| Metric | Description |
|---|---|
| CPU cores | Total number of CPU cores on the host (Docker) or across all cluster nodes (Kubernetes) |
| CPU usage | Current overall CPU usage as a percentage |
| Memory | Total memory on the host or across all cluster nodes |
| Memory usage | Current overall memory usage as a percentage |
The Docker agent also collects disk metrics for device-backed filesystems on the host, reported as one entry per block device:
| Metric | Description |
|---|---|
| Device | The block device (e.g. /dev/sda1) |
| Mount path | A representative mount path for the device (e.g. /) |
| Filesystem type | The filesystem type (e.g. ext4, xfs) |
| Total bytes | Total disk capacity |
| Used bytes | Current disk usage |
Disk metrics are reported per device, not per mount point; multiple mount points for the same block device are deduplicated into a single metric. Read-only and virtual filesystems (such as SquashFS mounts) are excluded. You can configure alerts to notify you when disk usage exceeds a threshold.
Reconnect
Section titled “Reconnect”Reconnect generates a new connection command for a deployment target. Use it when the agent has lost its connection and cannot recover on its own.
To reconnect:
- Click the ⋮ menu on the deployment target and select Reconnect.
- Review the warning and confirm. The previous credentials are invalidated the moment you confirm — there is no undo.
- Copy the new command and run it on the deployment host.
Reconnecting does not affect your running deployments. If your application was running before the reconnect, it continues running. The agent only manages the connection back to Distr, not the application lifecycle.
Troubleshooting: Stale Status
Section titled “Troubleshooting: Stale Status”A Stale deployment target means the agent was previously connected but has not reported its health in the last 60 seconds. It does not mean your deployment is broken — your application may still be running normally. Distr has simply lost contact with the agent.
Step 1: Check the Agent Logs
Open the ⋮ menu on the deployment target and select Agent Logs. Look for the last timestamp in the log to see when the agent stopped reporting, and check for any error messages that indicate why it disconnected.
Step 2: Reconnect
If you have access to the deployment host:
- Click Reconnect in the ⋮ menu.
- Confirm. A new
targetSecretis generated and the old one is invalidated immediately. - Run the new install command on the deployment host to re-establish the connection.
If you do not have direct access to the deployment host, ask the customer to reconnect from the Customer Portal. They will find the same ⋮ menu and Reconnect option in their deployment target view.