Logs & Metrics
Distr gives you three layers of observability for every deployment target: status indicators that show health at a glance, logs that let you dig into what happened, and metrics that track resource usage over time.
Deployment Target Status
Section titled “Deployment Target Status”Every deployment target shows a colored dot to the left of its name in the Deployments view. This status is always on — there is nothing to enable.
The Distr agent reports its health every 5 seconds, so the status reflects near-real-time connectivity:
- ⚫ Not connected — The agent has never connected, or credentials have been invalidated.
- 🟢 Connected — The agent is actively reporting.
- 🟡 Stale — The agent was connected before but has not reported in the last 60 seconds. Your deployments may still be running; Distr has simply lost contact with the agent. Only in this state can you reconnect by generating new credentials from the ⋮ menu.
Deployment Status
Section titled “Deployment Status”Each deployment within a target also has its own status indicator. This tells you whether the application itself is healthy, not just whether the agent is reachable:
- ⚫ No status — The agent has not reported anything for this deployment yet.
- 🔴 Error — Something is wrong. Healthchecks are failing or the deployment encountered an error. Check the status logs for details.
- 🟡 Stale — The agent has not reported this deployment’s health in the last 60 seconds.
- 🔵 Progressing — The agent is installing or upgrading the deployment, or containers are still starting up.
- O Running — The deployment is running but no healthchecks are configured.
- 🟢 Healthy — The deployment is running and all healthchecks are passing.
Healthchecks
Section titled “Healthchecks”Configure healthchecks so Distr can distinguish between Running (no checks configured) and Healthy (checks passing). Without them, a deployment that starts but serves errors will still show as Running.
- Docker deployments: Add a healthcheck to your service definition in the Compose file.
- Kubernetes deployments: Configure container probes (liveness, readiness, or startup probes).
Agent Logs
Section titled “Agent Logs”Agent logs show the raw output from the Distr agent process itself — connection events, deployment reconciliation cycles, errors, and status reports. These logs belong to the deployment target, not to any individual deployment.
To view them:
- Find the deployment target in the Deployments view.
- Click the ⋮ (vertical ellipsis) menu in the top-right of the deployment target card.
- Select Agent Logs.
The log viewer shows a timestamped stream of agent activity. This is the first place to look when a deployment target shows an unexpected status or stops reporting.
Container Logs
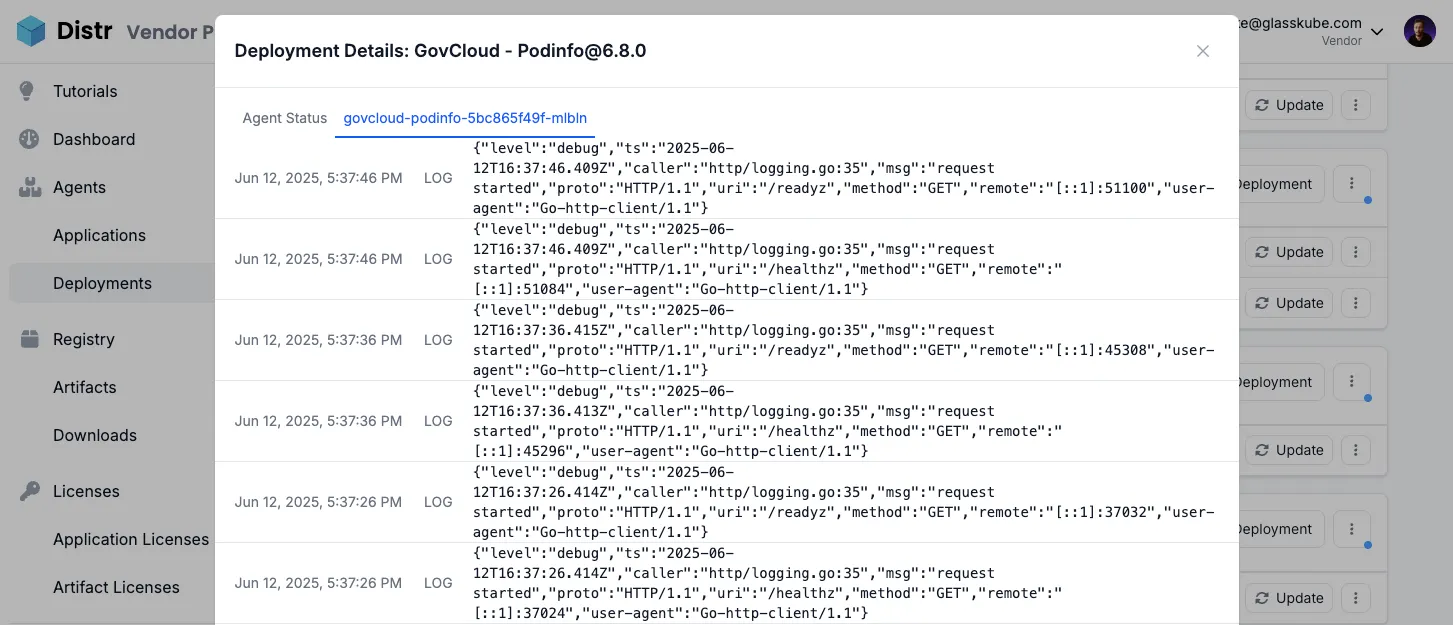
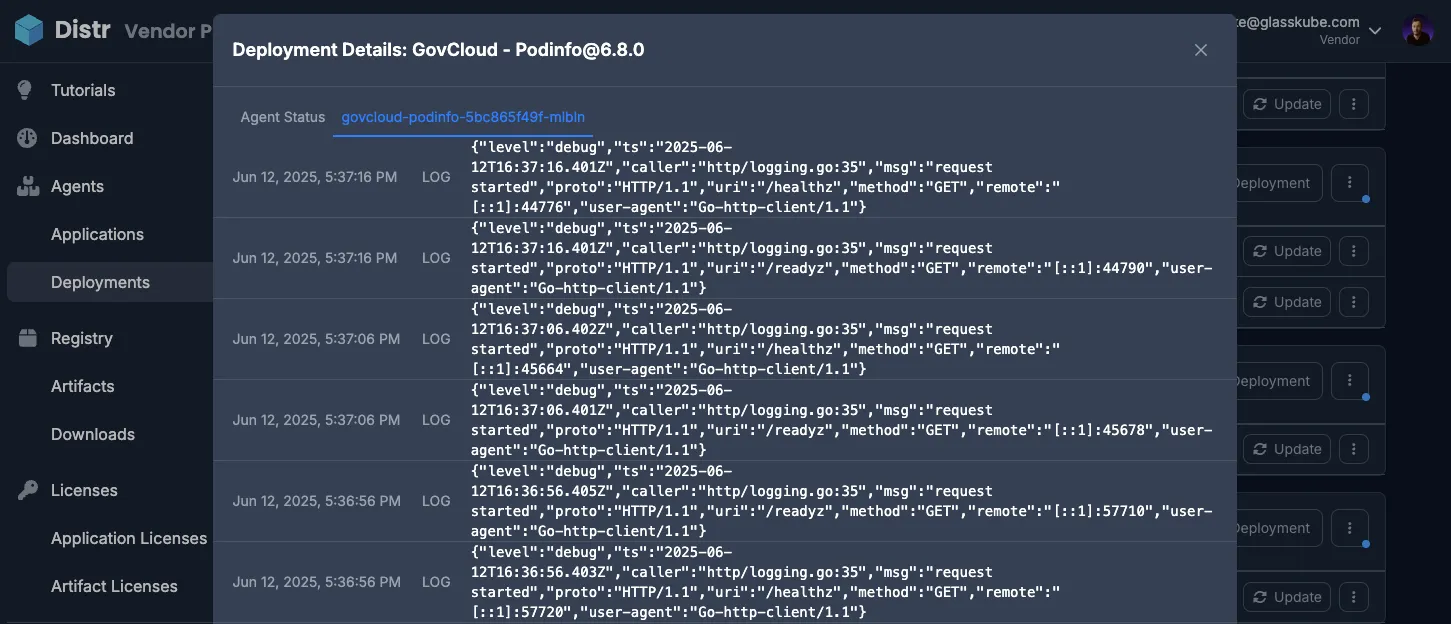
Section titled “Container Logs”Container logs show the output from your application containers. Unlike agent logs, container logs are not enabled by default — you activate them per deployment.
Enabling Container Logs
Section titled “Enabling Container Logs”- In the Deployments view, find the deployment you want to monitor.
- Click the ⋮ menu on the deployment.
- Select Enable log collection.
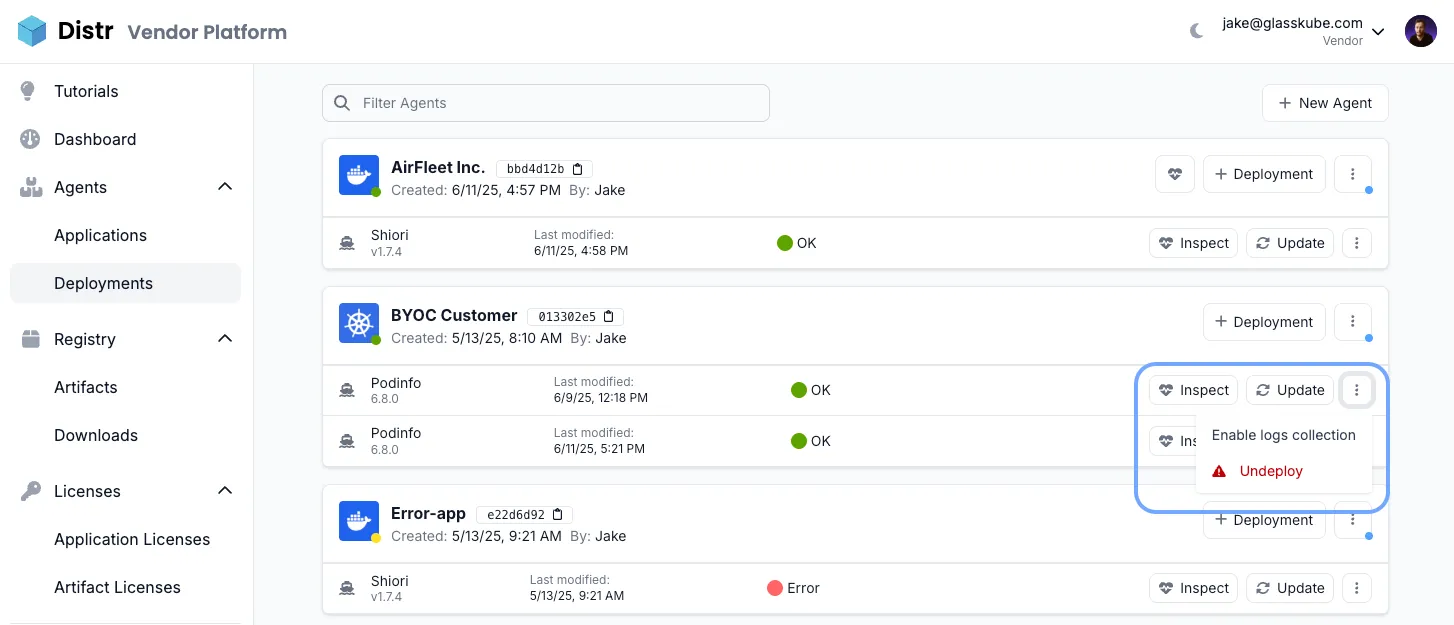
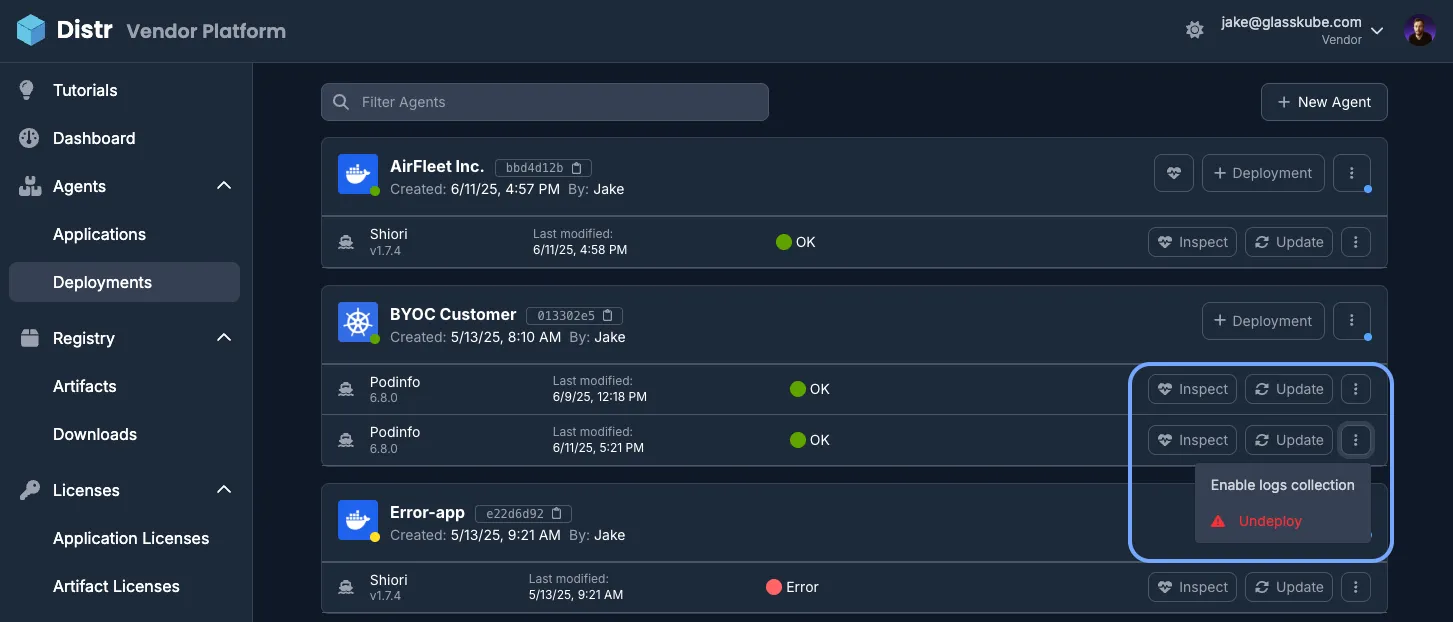
The first logs should appear within 30 seconds. Once enabled, logs are collected and updated every 30 seconds, providing near-real-time visibility into your application’s output.
To disable log collection, open the same ⋮ menu and select Disable log collection.
Metrics
Section titled “Metrics”Metrics give you visibility into the resource usage of the host or cluster running your deployments. Metrics collection can be toggled per deployment target.
Enabling Metrics
Section titled “Enabling Metrics”- Navigate to the deployment target in the Deployments view.
- Click the ⋮ menu and select Edit.
- Enable the metrics toggle.
Once enabled, the agent scrapes and reports metrics every 30 seconds.
Collected Metrics
Section titled “Collected Metrics”The following metrics are collected for both Docker and Kubernetes deployment targets:
| Metric | Description |
|---|---|
| CPU cores | Total number of CPU cores on the host (Docker) or across all cluster nodes (Kubernetes) |
| CPU usage | Current overall CPU usage as a percentage |
| Memory | Total memory on the host or across all cluster nodes |
| Memory usage | Current overall memory usage as a percentage |
Reconnect
Section titled “Reconnect”Reconnect generates a new connection command for a deployment target. Use it when the agent has lost its connection and cannot recover on its own.
To reconnect:
- Click the ⋮ menu on the deployment target and select Reconnect.
- Review the warning and confirm. The previous credentials are invalidated the moment you confirm — there is no undo.
- Copy the new command and run it on the deployment host.
Reconnecting does not affect your running deployments. If your application was running before the reconnect, it continues running. The agent only manages the connection back to Distr, not the application lifecycle.
Troubleshooting: Stale Status
Section titled “Troubleshooting: Stale Status”A Stale deployment target means the agent was previously connected but has not reported its health in the last 60 seconds. It does not mean your deployment is broken — your application may still be running normally. Distr has simply lost contact with the agent.
Step 1: Check the Agent Logs
Open the ⋮ menu on the deployment target and select Agent Logs. Look for the last timestamp in the log to see when the agent stopped reporting, and check for any error messages that indicate why it disconnected.
Step 2: Reconnect
If you have access to the deployment host:
- Click Reconnect in the ⋮ menu.
- Confirm. A new
targetSecretis generated and the old one is invalidated immediately. - Run the new install command on the deployment host to re-establish the connection.
If you do not have direct access to the deployment host, ask the customer to reconnect from the Customer Portal. They will find the same ⋮ menu and Reconnect option in their deployment target view.